e-society classification
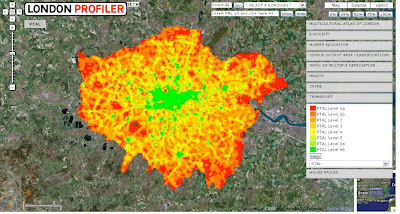
UCL has developed a fantastic new tool, still in Beta, which uses Google Maps and has a pretty good interface.
PTAL - Public Transport Accessibility Level
London Profiler builds up a picture of the geo-demographics of Greater London from data on population attributes such as cultural/ethnicity, deprivation, the extent of e-literacy, level of higher education, and health related problems.
London's Welsh
You can "visualise themes at different scales, search by postcode or zoom at borough level, to change the layer's transparency and to add KML layers". Loads quickly and all it's missing is a 'how to use' link.
Index of multiple deprivation
It's amazing, really, that the BBC covered this solely as about 'Mapping London's immigration', which is actually wrong. I don't see a map showing how the early C20th Jewish emigres landed in the East End then moved to North London ...
New blog
All new content on my restarted blog is here
Thursday, April 10
A new view of London
poster ··· ·· · ·
paulocanning
··· ·· · ·
10.4.08
Tweet This! ♦ Add to del.icio.us ♦ DiggIt! ♦ Add to Reddit ♦ Stumble This ♦ Add to Google Bookmarks ♦ Add to Yahoo MyWeb ♦ Add to Technorati Faves ♦ Slashdot it ♦
Subscribe to:
Post Comments (Atom)


0 comments:
Post a Comment